Thursday, May 7, 2015

Assignment 3: Small-Scale Climate Controls, & Comparing Locations

Let's look at the weather station that's behind a lot of the analysis on this project. "Christchurch Aero" (4843 in the NIWA database) is located, as its name suggests, at the Christchurch Airport.

Meso- and Micro-scale climate factors


Here in Denver, we have to do a lot of mental re-figuring to convert NOAA's airport-centered weather data into "city" terms. The DIA weather station is pretty far out on the prairie, about 30 km away from Denver's core urban heat island and subject to different wind patterns than UCD's weather station in the inner city.

In Christchurch that disparity isn't quite as pronounced. The airport is in the western suburbs about 8 km from the city center, so although its temperatures will be a bit lower than those recorded by a weather station downtown, the difference isn't as large as the difference between DIA and UCD.

Looking at this satellite image, it appears that the station's proximity to large areas of irrigated agriculture might be an anthropogenic micro-scale factor affecting its readings:

New Zealand Aero (station 4843). Weather Underground pinpoints its location at 43°29'34.80"S and 172°32'13.20"E, about halfway between downtown and the Waimakariri river.
Image: screen capture from Google Earth
Actually, however, pretty much the entire Canterbury plain is irrigated agriculture. (They grow all the produce that sustains the Northern Hemisphere through the winter.) Zooming out reveals that the larger factor by far is the ocean, which provides humidity and moderates seasonal and diurnal temperatures for the whole region.

Let's get some perspective on the situation. Oh hi ocean... you're probably adding more moisture to the air than the irrigated fields do.
 Fun Fact: Pegasus Bay is a popular retirement spot for My Little Ponies.  
Image: screen capture from Google Earth. 
Meso-scale factors affecting Christchurch include foehn winds and sea breezes.

The foehns off the eastern slope of the Alps were mentioned in the first post. Called the Chinook in our part of the world, and the Nor'wester in New Zealand, they're a product of the temperature and pressure difference between the windward and leeward side of the mountain range. Humid air masses off the ocean cool rapidly as they ascend the western slope, but the cooling rate slows as moisture condenses and releases latent heat. As the air mass descends on the leeward side, having released its moisture as rain or snow, it now warms more quickly at the dry adiabatic lapse rate. The relatively low pressure on the eastern plain sucks this air quickly across the landscape, often warming the region by several degrees in a short time.


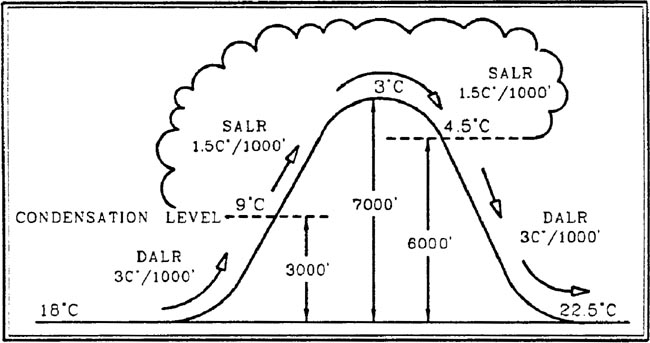
I'm including this diagram because it's so bad it's good, and thus so good it's perfect. A high school physical sciences teacher from "my day" (or before) evidently made this on a typewriter, a feat which I can guarantee, having done similar things myself in the days before regular people had computers, takes some excellent carriage-return skills. Nostalgia is a powerful thing.
Image from http://www.learninginfo.org/sandbox/foehn-wind.htm (and before that, maybe Mr. Crowell's banker-box of overhead transparencies).
And now for Something Completely Different:
"Get up for the downslope [winds]; everybody get up"...

OK, OK, no need for the cane; I'll see myself out.
Sea Breezes

Another meso-scale factor affecting the Christchurch Aero weather station is the sea breezes. In the spring and summer, as the island receives increasing insolation, inland areas heat up faster than the ocean. The resulting low pressure over land draws cooler air westward, lowering temperatures in Christchurch.


Friendship is Magic in Pegasus Bay! And sea breezes are delightful! Twilight Sparkle seems concerned by Pinkie Pie's trajectory, perhaps because she lacks wings. But no ponies were harmed in the making of this graphic.
Diagram from https://www.blendspace.com/lessons/SNmjP2UrHdIDzQ/global-and-local-windMLPs added in Photoshop from miscellaneous fandom blogs.
The effect isn't as pronounced for Christchurch Aero as it is for coastal stations, like New Brighton Pier about 16 km east of the airport, so people on the eastern side of the city would want to obtain their forecasts from coastal rather than inland weather stations.

As mentioned in previous posts, the Canterbury Plain is arid relative to the Southern Alps range on its west, which wrings out moisture from the weather systems that the prevailing Westerlies push across the island. Although the Plain is in a humid maritime climate zone, it's also in a "rain shadow":


The South Island's outline overlaid in Photoshop on a May 6, 2015 Weather Underground map. Precipitation totals from weather stations around the island indicate the rain shadow. To the west, the mountain stations are showing moisture accumulation, while the eastern plains, including the airport station (highlighted) are dry.
Climographs reveal the magnitude of the difference in yearly rainfall on the mountains versus the plains:

Arrows point to May precipitation levels for Milford Sound and Christchurch Aero. Milford Sound averages 650 mm while Christchurch averages 60.
Climographs from https://www.niwa.co.nz; image from Google Earth


Temperature Trends Over Time

This weather station has recorded data going back to 1954, but unfortunately Niwa's CliFlo database doesn't provide it in spreadsheet format. (Don't even ask about Weather Underground, because they have some pretty silly ideas about effective data presentation.) Below are the monthly average minimum and maximum temperatures for January and July from 1985 to 2014:


Seasonal minimum and maximum average temperatures at Christchurch Aero.
Data from https://www.niwa.co.nz plotted in Excel
The temperatures have declined slightly over the past thirty years, on average. Is global warming a myth? No, it's just hard to prove with only thirty years of data from one weather station in an isolated geographic area. One thing to notice is the pronounced dip and spike in the summer (January) maximum around 1997-1999. It turns out there was a strong El Nino-La Nina event during that period:


ENSO events plotted using NOAA's OSI (Oceanic Nino Index), which is based on 3-month overlapping mean sea surface temperature anomalies. 1997-1998 was a "strong" El Nino year.
Graph from http://ggweather.com/enso/oni.htm

Global warming is definitely affecting New Zealand, however. According to the New Zealand government, average temperatures have risen 0.9C over the past century - 0.2 degrees more than the worldwide average increase. According to the WWF (that's the Panda WWF, not the "Gorilla Monsoon" WWF), average sea levels in the islands' four major ports have risen 16 cm in the past 100 years, and glaciers in the Southern Alps have lost 11% of their ice in just the past thirty years. 

Comparison to A Location From a Classmate's Blog

Some people in this class should clearly be meteorologists. (I'm not one of them.) Some other people should probably not blog at all. (I'm probably one of those.) A few others used Tumblr for this assignment, but I'm too old to get a Tumblr account even with a course grade at stake. The latter two criteria eliminate about 75% of the class blogs, including some locations I'd hoped to compare with mine. 

Therefore, I chose Bangkok, Thailand, because Chris's blog is really well done, and because while Bangkok's terrestrial geography is similar to New Zealand's, its climate is very very different.

Similarities between Bangkok and Christchurch:

- Both are at a low elevation
- Both have mountains to the west of the city
- Both are next to a large ocean area that moderates temperatures ranges
- Both are dominated by maritime air masses

Differences between Bangkok and Christchurch:

Everything else!

- Bangkok is between the Tropic of Cancer and the Equator, so it's much hotter than Christchurch, with highs between 95 and 100F, and lows between 70 and 80F

- Due to Bangkok's tropical location, those temperatures prevail throughout the year, whereas Christchurch, in the midlatitudes, has cold winters

- The ITCZ is Bangkok's primary macro-scale climate control; the location of the Antarctic polar front is Christchurch's

- The migration of the ITCZ brings a monsoon season to Bangkok from May through October; Christchurch gets most of its moisture in the winter, but it sure as heck isn't anything close to monsoonal

- Bangkok's prevailing winds are the Southeast Trades, while New Zealand, much farther from the equator, gets the Westerlies

- Bangkok receives tropical cyclones (typhoons) off the warm equatorial ocean, rather than the midlatitude cold-occluded cyclones that affect Christchurch

- Bangkok's mountains disrupt cold air masses moving south from the Asian continent, so it doesn't tend to get cold fronts

- Continental polar air masses do migrate south over Thailand in the winter when the ITCZ is to the south, bringing high pressure and drier air; Christchurch has no continents nearby that would perform this function


What, is the blog done so soon? Just like that?
Yes, it's time to leave New Zealand to its weather,
and move on to other projects.


Saturday, April 11, 2015

Assignment 2: Air Masses, Fronts, and Cyclones

Now let's look at the air masses and circulation systems that produce New Zealand's weather. The first thing to note is that in the Southern Hemisphere, cyclones (low pressure systems) flow clockwise, and anticyclones (high pressure systems) flow counter-clockwise.

Wind Map:
We're not in Kansas anymore! This map of surface winds shows mid-latitude cyclonic patterns in the Southern Ocean and the Tasman Sea on April 5, 2015. The Coriolis effect deflects airflow significantly to the left in the latitudes of the Westerlies (~30-60 degrees South) where the polar and tropical air masses meet, producing the cyclonic patterns shown. Weather can get severe this time of year, due to the contrast between the lingering high ocean temperatures and the potential for Polar air masses to "break out" of their wave pattern as the sun leaves the Antarctic.
Arrows added in Illustrator to a screen capture from  http://earth.nullschool.net/#current/wind/surface/level/orthographic=172.44,-52.75,270
Polar views of the general air circulation patterns can give us some perspective on the process. The Southern Hemisphere has an upper-level jet/wave pattern similar to the Northern Hemisphere Jet Stream. However, the Southern Hemisphere Jet doesn't migrate seasonally as much as the Northern one, because the temperatures change less abruptly over the ocean than over land. 

Upper Level Circulation:


Upper-level airflow in the Southern Ocean. I won't go into the physics of the zonal and meridional wind components depicted in color here (because I don't understand it). Basically, the undulations roughly correspond to the waves of the Antarctic Jet. And isn't it neat to see what Earth would look like as a lava lamp? Science is so awesome. 
Video created by Matt Owens for Fairfax Climate Watch, from
http://www.fairfaxclimatewatch.com/blog/2013/11/the-rise-and-fall-of-the-westerlies.html

Another view of the Antarctic wave - blue are troughs and pink are ridges. 
The fourteen-year-old in me just can't resist calling attention to the title of this photo (top left, by the date). Those kinky Kiwis!! 
Image from MetService weather blog at
http://blog.metservice.com/2011/07/a-winter-storm/
These maps from Earth.nullschool.net depict wind flow as a still image, making it easier to see the smaller patterns of convergence, divergence and mixing:

This image of 500-millibar level winds shows the Antarctic Jet really well. There is an intensified low to the east of New Zealand at the boundary between cold and warm air masses - what they call a "polar outbreak". More about that below.
Screen capture from  http://earth.nullschool.net
Surface winds and temperatures. Lots of confrontation between polar and tropical air masses, in latitutes with high vorticity, promotes cyclonogenesis with support from the upper level Jet Stream.
Screen capture from  http://earth.nullschool.net
So those are some of the main large-scale air circulation patterns. Now we'll look at how the air masses come into play. Unlike in the U.S. (and the Northern Hemisphere in general), there isn't much land down there to create large temperature differences, so New Zealand doesn't see our strong tornadoes and surface-heat-driven mesoscale convective complexes. However, it is in the latitudes between the subpolar low and the subtropical high, so it gets plenty of midlatitude cyclones and their associated thunderstorms. 

New Zealand is affected primarily by mP and mT air masses throughout the year. The cold Antarctic air starts out as cAA, but it takes on enough heat and moisture crossing the ocean that it's mP air when it reaches New Zealand. For its part, the warm tropical air is just... warm tropical air, heading south to cool off. Thanks to some help from the Coriolis effect and the wave flow aloft, New Zealand gets the cold-type occluded fronts that supply Christchurch's winter moisture.

Some weather maps will show us how this plays out.

Surface Pressure, Sunday April 5 at Noon:


Here we can see a broad high pressure system covering New Zealand, and lots of cyclonic lows and mini-fronts buzzing around the ocean to the south. The low at 1008 in the upper middle of the frame, just off the east coast of Australia, is going to deepen and dump a bunch of moisture on the Southern Alps in the next 48 hours, as the warm front gets occluded by the polar air and develops precipitation.
New Zealand highlighted in Photoshop on a surface pressure chart from MetService New Zealand  http://www.metservice.com/maps-radar/maps/tasman-sea-nz
Surface Pressure, Monday April 6 at Noon:


24 hours later, the high has moved to the southeast with the zonal flow aloft. The pressure gradient has increased sharply, the low has deepened to 992 millibars, and it's now being occluded by the cold air continuing to flow up and around from the west with the Jet stream. There's a fair amount of moisture in this system, and it's piling up against the Southern Alps along the northwestern edge of the South Island. (Notice the pressure ridge that defines the mountain range and hints at the orographic effect.)
New Zealand highlighted in Photoshop on a surface pressure chart by MetService New Zealand: http://www.metservice.com/maps-radar/maps/tasman-sea-nz
This system produces the typical precipitation pattern of a cold-type occluded front, only upside-down, because this is the Southern Hemisphere.

Rain:


This map has both the upper level winds and the surface pressures, so we can see the system in action. At noon on Monday, April 6, the low is off the west coast. Warmer colors depict areas of higher precipitation. The low is 988 millibars with heavy rain over the ocean. According to MetService's 30-day weather history, surface winds were hitting Queenstown, which is roughly equivalent to Evergreen in terms of aspect and elevation, from the northeast at 50km/hour, and brought only 1.2 mm of rain. Christchurch had similar wind speed and direction, and received no precipitation.
Map from 5-Day Rain Forecast page at MetService New Zealand
http://www.metservice.com/maps-radar/rain-forecast/rain-forecast-5-day
Now at 12 AM on April 7, the "head" of the system has moved around the southern tip of the South Island, and orographic precipitation is occurring along its "tail" on the western side of the Alps. The cold occluded front has developed what we will assume are cumulus and cumulonimbus clouds. According to Weather Underground's history for station 93800, the southwestern tip of the island got half an inch of rain. And according to MetService, Christchurch got zero, because the precipitation all got wrung out over the Alps just as it does over the Rockies before it reaches Denver.
Map from 5-Day Rain Forecast page at MetService New Zealand
http://www.metservice.com/maps-radar/rain-forecast/rain-forecast-5-day
New Zealand also sees standard cold-front cloud formation and precipitation patterns, as well as Polar Outbreaks like we get in the US (only theirs are maritime, not continental).

Surface Pressure & Infrared:

Surface pressure and fronts (top) and infrared (bottom) for 6 AM Sunday, April 12, which at the time of this writing, hasn't happened yet. Except it has, in New Zealand, which is at UTC +13. If we're at UTC -6, then they've already had nineteen hours of our tomorrow happen. OK, I'm confused now...
Anyway, check out how well the pressure map and the cloud map line up! So illustrative. The low pressure system off the southeast coast is attached to a cold front that has some lovely cloud formation along its spine. But... this is not your normal, everyday fall cold front; this is a "Polar Blast" in the making! (See below.)
New Zealand highlighted in Photoshop on maps from MetService New Zealand
 http://www.metservice.com/maps-radar/satellite/tasman-sea-nz-infrared 
Oh Dear God! Can you believe this crap??
Actually, if you're anything like me, you're probably like "ummm okaaaaay, nice weather map." But no!! This is the beginning of a Serious. Polar. Blast. (AKA Polar Outbreak.) You know when American TV weatherpeople are all like "OMG a Polar Vortex is coming!!" like there's more than one lurking up there? The Kiwis are smarter than that; they just call it like it is (which doesn't make it any less exciting). A bunch of damn cold air is about to blast up from Antarctica and snow all over their lovely islands. I would feel sorry for them, but I'm all "sorried out" after sympathizing with my New England family and friends all winter.
Image from MetService Weather Blog
http://blog.metservice.com/2011/07/a-winter-storm/
Look at all that COLD mPk air just waltzing up from the Antarctic. It's getting warmed from below enough to create instability, and bringing some unseasonably low temperatures, snow showers, and high unruly seas to the region. The worst swells are predicted directly under the low.
Image from
http://www.metservice.com/maps-radar/rain-forecast/rain-forecast-5-day
Wow, that's a serious blob of cold air pushing its way north. Low temperatures are blue and green, at the 500-millibar level, and windspeeds at the 250-millibar level are denoted with numbers too small for us to see or worry about.
Image from 
http://blog.metservice.com/2015/04/winter-is-coming-for-a-bit-updated-friday-10-april-2015/

Occasionally, extra-tropical cyclones develop into hurricanes that affect the region, especially in the late summer and early fall. The most recent was Hurricane Pam, a category 5 cyclone, which devastated the South Pacific islands of Vanuatu with a central pressure of 896 millibars and 250 km/h winds, but largely tracked northeast of New Zealand as detailed in MetService New Zealand's summary

That's all I've got to say about how New Zealand's air masses and the South Island's mountains affect Christchurch's weather. Let's leave them to enjoy their winter prequel.


Lose something, guys?
Image from 
http://designingsound.org/2010/09/david-farmer-special-the-lord-of-the-rings-exclusive-interview/

Thursday, March 12, 2015

Christchurch, New Zealand Assignment 1: Climate and Weather Summary

Located at 43°31′48″S, 172°37′13″E, in New Zealand's "Eastern South Island" climate zone, the mid-latitude, maritime city of Christchurch has a mild climate compared to Denver, which it somewhat resembles (when you're not facing the ocean):
THIS IS TOTALLY DENVER, RIGHT? YEAH, NO.
Denver's climate is continental, which means big annual temperature differences ranging from -20F in the winter to 100F in summer. Christchurch, in contrast, might range from 45F to 80F (7 to 26 degrees Celsius). 
Mountains AND ocean AND Hobbits? Sounds awesome to me.
"Christchurch City" by Photographer: P. Stalder (English user page) / P. Stalder (deutsche Benutzerseite)
 Licensed under CC BY-SA 3.0 via Wikimedia Commons
Christchurch's weather patterns are influenced by the prevailing winds, the Southern Alps mountain range to the west and the Pacific Ocean to the east. They are also affected by El Nino events.

30-year mean monthly temperatures:
I WANT TO LIVE HERE. DON'T YOU? WELL, I DON'T KNOW... 
THE WHOLE "SUMMER IN FEBRUARY" THING SEEMS WRONG TO ME.
 Created in Microsoft Excel with data obtained 3/10/2015 from NIWA's database for Christchurch Aero weather station
Its warmest summer temperatures (December through March) are produced by northwesterly foehns off the mountains, but summer highs are moderated by localized convective lifting from the heat island effect, which augments the sea breeze off the prevailing anticyclonic air flow at sea level.

Mean summer daytime highs range between 18-26 degrees Celsius, with a 30-year mean high of 22.7 degrees in January for 1981-2010 - though the monthly mean has ranged as high as 35.9 (in February 2011). 

The mean diurnal temperature difference is remarkably constant throughout the year due to the moderating ocean.

Westerly and northwesterly winds prevail throughout much of the year. In the warmer months, Christchurch is "caught" between two subtropical high pressure zones that generally serve to stabilize its weather patterns.
Summer prevailing subtropical high pressure systems.
Westerlies can sometimes develop depressions that bring strong winds and heavy rain to the western and northwestern areas of the islands, but little of the precipitation reaches Christchurch on the eastern coast.
From the
Encyclopedia of New Zealand
http://www.teara.govt.nz/en/map/7747/mean-atmospheric-pressure-1971-2000
Its winters, though!!
I'M THINKING MAYBE CARADHRAS WAS A BAD IDEA, FRODO.
Image from http://mikelrico.biz/Proyectos/magosybrujasencineytv.es/archivos/PELICULAS_archivos/esdla.HTM
Just kidding. Christchurch's winters do get cold, with around 99 frost days per year, and it does experience snow, but with a mean low temperature of 1.9C in July, the city's average winter low only differs from its summer high by about 20C. 

Christchurch's temperate, maritime humid climate doesn't get as much rainfall as might be expected. Precipitation occurs throughout the year, with somewhat higher amounts in the winter months and more dry spells in summer. The East Australian Current brings warm water to the island's western side, which helps drive cloud formation, and the prevailing westerlies move the moisture eastward; however, the orographic effect limits precipitation on the eastern plains. 
RAIN, BUT NOT TOO RAINY.
 Christchurch receives an average of only 600-700 mm of precipitation per year.
(http://www.teara.govt.nz/en/climate/page-2).
Graph created in Microsoft Excel with data obtained 3/10/2015 from NIWA's database for Christchurch Aero weather station
The orographic effect in action! Christchurch, in the orange area just above the little green mountain jutting out about 2/3 of the way up the South Island's eastern coast, is in the 500-760 mm range, whereas the Divide of the Southern Alps only a hundred kilometers away often receives 10,000 mm. 
https://www.niwa.co.nz/sites/niwa.co.nz/files/sites/default/files/images/climate_-_nz_rainfall_1971-2000.jpg
Christchurch's weather and climate are also influenced by ENSO.
During El Nino events, Pacific heat and moisture shift eastward, producing stronger southwesterly winds and cooler temperatures. Although the west coast of the South island gets more precipitation during those periods, the Christchurch area remains drier.
During La Ninas, high pressure intensifies to the east of the South Island, producing warmer temperatures and drier conditions west of the mountains, which can result in actual drought for the eastern plains.

http://www.teara.govt.nz/en/climate/page-3 
Christchurch's Bowen ratio is probably around 0.6. The city is much more humid than Denver (which is 1.5), and it's on the ocean (which is 0.1). Relative humidity ranges from 47%-97% but averages around 80%. If Europe averages 0.62 including inland continental areas, and New Zealand's South Island climate is roughly similar but closer to the ocean, then it should be a bit lower than Europe, and definitely lower than the average worldwide land value of 0.96.


THE FELLOWSHIP WILL CONSIDER THE VALIDITY OF THIS ESTIMATE. 
LOOK FOR THEIR DECISION AT SUNRISE ON THE THIRD DAY. 
http://gulfnews.com/polopoly_fs/1.969945!/image/3907449654.jpg_gen/derivatives/box_475/3907449654.jpg